This is the first article in the Systrace series, primarily providing a brief introduction to Systrace, its basic usage, how to interpret Systrace traces, and how to analyze phenomena in Systrace in conjunction with other tools.
The purpose of this series is to view the overall operation of the Android system from a different perspective using Systrace, while also providing an alternative angle for learning the Framework. Perhaps you’ve read many articles about the Framework but can never remember the code, or you’re unclear about the execution flow. Maybe from Systrace’s graphical perspective, you can gain a deeper understanding.
Table of Contents
- Perfetto Series Article Index
- Systrace Series Article Index
- Main Content
- Simple Usage of Systrace
- Capturing Systrace with Command-Line Tools
- Viewing Supported TAGs
- About Me && Blog
Perfetto Series Article Index
How the Systrace workflow changed after Perfetto
When this article first described Systrace, the main workflow was systrace.py calling atrace, collecting ftrace and ATrace data, generating HTML, and opening it in Chrome. Today, split that flow into two layers:
- The underlying mechanisms are still useful:
android.os.Trace, native ATrace macros, ATrace in system services, Linux ftrace, and CPU scheduling events remain core data sources for Android performance analysis. - The tool workflow changed: current
platform-toolsno longer treatssystrace.pyas the main entry point. On Android 10 (API 29) and later, System Tracing mainly produces.perfetto-tracefiles, and the default analysis tools are Perfetto UI andtrace_processor. - There are three common capture paths now: use the System Tracing Quick Settings tile for interactive issues; use
adb shell perfetto ... --out /data/misc/perfetto-traces/xxx.perfetto-tracefor reproducible issues; use a Perfetto config or therecord_android_tracescript when the configuration needs to be stable and repeatable. - The Systrace concepts in this article map to Perfetto 1: Introduction, Perfetto 2: Capturing traces, and Perfetto 3: Perfetto View.
Perfetto is not just a different web viewer. It puts short traces, long traces, protobuf files, SQL, metrics, command-line processing, and large-file analysis into one system. The old Systrace HTML flow is still good for quick visual inspection; the current Perfetto flow is better when the analysis needs search, filtering, SQL, metrics, or automation.
I will continue to update the Perfetto series, and all future illustrations will use Perfetto. The underlying knowledge points are common between Systrace and Perfetto, so don’t worry about which one to use—you can learn from both series.
Perfetto Series Article Index
- Android Perfetto Series Index
- Android Perfetto Series 1: Introduction to Perfetto
- Android Perfetto Series 2: Capturing Perfetto Traces
- Android Perfetto Series 3: Getting Familiar with Perfetto View
- Android Perfetto Series 4: Opening Large Traces Locally Using Command Line
- Android Perfetto Series 5: Android App Rendering Pipeline Based on Choreographer
- Android Perfetto Series 6: Why 120Hz? Advantages and Challenges of High Refresh Rate
- Android Perfetto Series 7 - MainThread and RenderThread Explained
- Android Perfetto Series 8: Deep Dive into Vsync Mechanism and Performance Analysis
- Android Perfetto Series 9 - CPU Information Explained
- Android Perfetto Series 10: Binder Scheduling and Lock Contention
- Video (Bilibili) - Android Perfetto Basics and Case Studies
- Video (Bilibili) - Android Perfetto: Trace Graph Types - AOSP, WebView, Flutter + OEM System Optimization
Systrace Series Article Index
- Introduction to Systrace
- Systrace Basics - Prerequisites for Systrace
- Systrace Basics - Why 60 fps?
- Android Systrace Basics - SystemServer Explained
- Systrace Basics - SurfaceFlinger Explained
- Systrace Basics - Input Explained
- Systrace Basics - Vsync Explained
- Systrace Basics - Vsync-App: Detailed Explanation of Choreographer-Based Rendering Mechanism
- Systrace Basics - MainThread and RenderThread Explained
- Systrace Basics - Binder and Lock Contention Explained
- Systrace Basics - Triple Buffer Explained
- Systrace Basics - CPU Info Explained
- Systrace Smoothness in Action 1: Understanding Jank Principles
- Systrace Smoothness in Action 2: Case Analysis - MIUI Launcher Scroll Jank Analysis
- Systrace Smoothness in Action 3: FAQs During Jank Analysis
- Systrace Responsiveness in Action 1: Understanding Responsiveness Principles
- Systrace Responsiveness in Action 2: Responsiveness Analysis - Using App Startup as an Example
- Systrace Responsiveness in Action 3: Extended Knowledge on Responsiveness
- Systrace Thread CPU State Analysis Tips - Runnable
- Systrace Thread CPU State Analysis Tips - Running
- Systrace Thread CPU State Analysis Tips - Sleep and Uninterruptible Sleep
Main Content
Systrace is a performance data sampling and analysis tool introduced in Android 4.1. It helps developers collect execution information from key Android subsystems (such as SurfaceFlinger, SystemServer, Kernel, Input, Display, and other critical framework modules, services, and the View system), allowing for a more intuitive analysis of system bottlenecks and performance improvements.
Systrace’s capabilities include tracking system I/O operations, kernel workqueues, CPU load, and the health of various Android subsystems. On the Android platform, it’s composed of three main parts:
- Kernel Space: Systrace leverages the
ftracefeature in the Linux Kernel. Therefore, to use Systrace, the relevantftracemodules in the kernel must be enabled. - Data Collection: Android defines a
Traceclass that applications can use to output statistical information toftrace. Additionally, theatraceprogram in Android reads statistical info fromftraceand passes it to data analysis tools. - Data Analysis Tools: In the old flow, Android provided
systrace.py(a Python script once located underAndroid SDK directory/platform-tools/systrace) to configure collection and generate HTML. In the current flow,perfettorecords data into.perfetto-trace, while Perfetto UI andtrace_processoropen, query, and analyze it. Essentially, Systrace is a wrapper around Linux Kernelftrace; Perfetto continues to support ATrace/ftrace while integrating more data sources, file formats, and analysis capabilities. Applications can still use Android’sTraceclass to emit custom trace points.
Official documentation and usage for Systrace can be found here: Systrace
Design Philosophy of Systrace
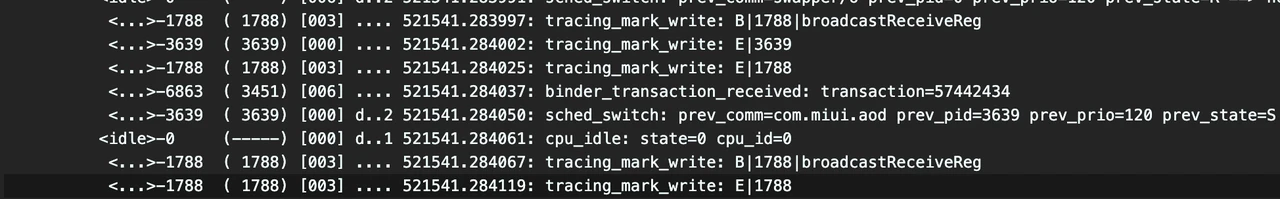
Key flows in the system (such as Touch operations, Power button presses, scrolling), system mechanisms (input dispatching, View rendering, IPC, process management), and hardware/software status (CPU frequency, CPU scheduling, disk info, memory info) have Log-like info inserted, known as TracePoints (essentially Ftrace info). These TracePoints demonstrate the execution time of core operations and the values of specific variables. The Android system then collects these TracePoints scattered across various processes and writes them into a file. After exporting this file, Systrace parses the data to provide an overview of system operation over a period of time.
Important modules in Android have TracePoints inserted by default, categorized by TraceTag:
- Framework Java-level TracePoints use the
android.os.Traceclass. - Framework Native-level TracePoints use
ATracemacros. - App developers can define custom traces using the
android.os.Traceclass.
Consequently, Systrace can collect and centrally display all information from both upper and lower layers of Android. For Android developers, Systrace’s greatest value is transforming the internal state of the Android system from a black box to a white box. Its global perspective and visualization make it the preferred choice for analyzing complex performance issues.
Practical Applications
Because it contains a wealth of system info, parsed Systrace files are naturally suited for analyzing performance issues in both Android Apps and the system itself. App developers, system developers, and Kernel developers can all use Systrace for performance analysis.
- From a technical standpoint, Systrace covers major performance categories: Responsiveness, Jank/Dropped Frames, and ANR.
- From a user perspective, Systrace can analyze issues including but not limited to:
- App startup speed (cold, hot, and warm start).
- Slow UI navigation or janky transitions.
- Sluggishness in non-navigation actions (toggles, popups, long-presses, selection, etc.).
- Slow screen on/off, power on/off, unlocking, or face recognition.
- List scrolling jank.
- Window animation jank.
- Content loading jank.
- System-wide sluggishness.
- App unresponsiveness (ANR), freezes, or crashes.
When encountering these issues, old systems can still use Systrace HTML and Chrome. On Android 10 and later, prefer System Tracing or perfetto to capture a .perfetto-trace file and analyze it in Perfetto UI. The methods in this series, such as reading threads, wakeups, CPU scheduling, and Binder waits, still apply; the entry point has moved from Chrome HTML to Perfetto tracks, search, the selection panel, and SQL.
Simple Usage of Systrace
Before using Systrace, understand how the usage changed across Android versions. Older articles mention Eclipse, Android Studio Device Monitor, and systrace.py; today, the recommended flow is System Tracing or Perfetto. The capture rhythm is similar, but the output file and analysis tool are different.
The old flow was:
- Prepare the UI you want to trace on the phone.
- Click to start capture, or run
systrace.pyfrom the command line. - Perform operations on the phone, keeping the reproduction short.
- When the configured duration ends, open
Trace.htmlin Chrome or the legacy UI.
The current flow is:
- Start recording from the System Tracing developer option, or run
adb shell perfetto. - Reproduce jank, slow response, slow launch, or another target issue.
- Export the
.perfetto-tracefile. - Open it in Perfetto UI, then use search, SQL, metrics, or
trace_processor_shellwhen visual inspection is not enough.
A typically captured Systrace file looks like this: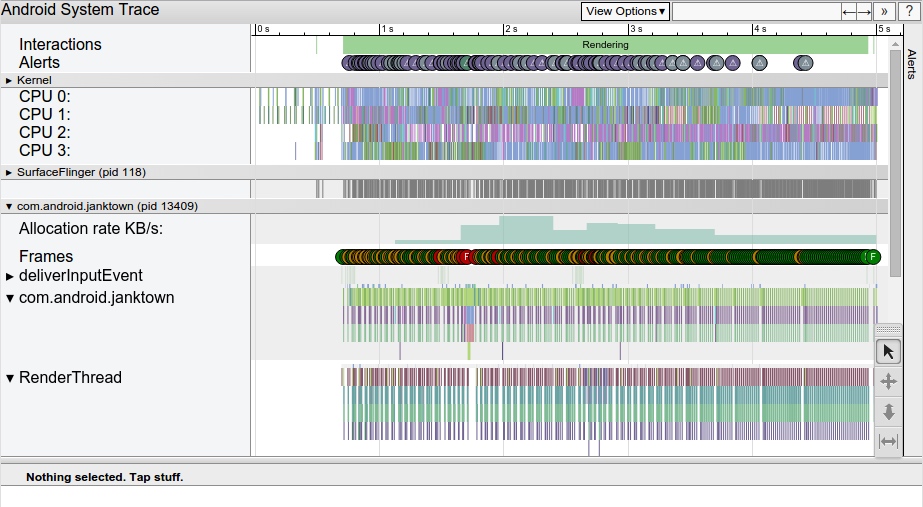
Capturing Systrace / Perfetto with Command-Line Tools
The command-line approach is more flexible and faster. Once configured, you can get results quickly (highly recommended).
The Systrace tool used to live under platform-tools/systrace in the Android SDK. Current platform-tools no longer treats systrace.py as the recommended entry point. If you need to reproduce the old flow, use version 33 or older. For current projects, use perfetto directly:
1 | adb shell perfetto -t 10s -b 64mb \ |
If you need app-level custom trace points, add the package name:
1 | adb shell perfetto -t 10s -b 64mb -a com.example.app \ |
The following is the old Systrace usage, useful for older systems or historical trace reproduction:
1 | $ cd android-sdk/platform-tools/systrace |
Configuring the path and an Alias in your Bash profile can make this very efficient. Traces from User builds contain less information than Eng or Userdebug builds. For system-service, kernel-scheduling, or vendor-policy issues, use a Userdebug device when possible. For normal app issues, User builds can still be a useful first pass through System Tracing or Perfetto, but some system detail will be missing.
After old Systrace capture, a Trace.html file is generated. After Perfetto capture, a .perfetto-trace file is generated. We’ll cover how to analyze trace files in later sections. The following options are the old systrace.py parameters:
1 | -a appname enable app-level tracing for a comma separated list of cmdlines; * is a wildcard matching any process |
While there are many parameters, you usually don’t need to worry about most of them when using tools—just check the boxes. In the CLI, we typically alias the command. For example:
1 | alias st-start='python /path-to-sdk/platform-tools/systrace/systrace.py' |
This allows you to simply type st-start to begin. Of course, to distinguish and save files, add -o filename.html. You don’t need to understand every parameter immediately; they will become familiar during the analysis process.
Commonly used parameters:
-o: Specifies the output file path and name.-t: Capture duration (you can press Enter to stop early in newer versions).-b: Specifies the buffer size (default is usually enough; increase it for longer traces).-a: Specifies the app package name (required for debugging custom TracePoints).
Viewing Supported TAGs
The default TAGs supported by Systrace can be viewed with the following command. Different manufacturers may have various configurations; you can choose and configure TAGs based on your needs. Selecting fewer TAGs results in smaller Trace files but less content. Large Trace files can impact Chrome’s performance during analysis, so choose wisely.
Using my Android 12 device as an example, it supports the following tags (tag name on the left, description on the right):
1 | adb shell atrace --list_categories |
About Me && Blog
Below is my personal intro and related links. I look forward to exchanging ideas with fellow professionals. “When three walk together, one can always be my teacher!”
- Blogger Intro: Includes personal WeChat and WeChat group links.
- Blog Content Navigation: A guide for my blog content.
- Curated Excellent Blog Articles - Android Performance Optimization Must-Knows: Welcome to recommend projects/articles.
- Android Performance Optimization Knowledge Planet: Welcome to join and thank you for your support~
One walks faster alone, but a group walks further together.