

The Singleton pattern, also known as the single-instance pattern, is a widely used software design pattern. When apply this pattern, the class must ensure that only one instance of the singleton object exists. In this article, we will explore the two primary ways to construct a singleton pattern and finally introduce a sophisticated yet concise approach.
Series Catalog:
- Overview of Android Performance Patterns
- Android Performance Patterns: Render Performance
- Android Performance Patterns: Understanding Overdraw
- Android Performance Patterns: Understanding VSYNC
- Android Performance Patterns: Profile GPU Rendering
“If you can measure it, you can optimize it” is a common term in the computing world, and for Android’s rendering system, the same thing holds true. In order to optimize your pipeline to be more efficient for rendering, you need a tool to give you feedback on where the current perf problems lie.
In this video, Colt McAnlis walks you through an on-device tool built for this exact reason. “Profile GPU Rendering” will help you understand the stages of the rendering pipeline, see which portions might be taking too long, and decide what to do about it in your application.
Profile GPU Rendering Tool
Rendering performance issues are often the culprits stealing your precious frames. These problems are easy to create but also easy to track with the right tools. Using the Profile GPU Rendering tool, you can see right on your device exactly what is causing your application to stutter or slow down.
Series Catalog:
- Overview of Android Performance Patterns
- Android Performance Patterns: Render Performance
- Android Performance Patterns: Understanding Overdraw
- Android Performance Patterns: Understanding VSYNC
- Android Performance Patterns: Profile GPU Rendering
Unbeknownst to most developers, there’s a simple hardware design that defines everything about how fast your application can draw things to the screen.
You may have heard the term VSYNC - VSYNC stands for vertical synchronization and it’s an event that happens every time your screen starts to refresh the content it wants to show you.
Effectively, VSYNC is the product of two components: Refresh Rate (how fast the hardware can refresh the screen), and Frames Per Second (how fast the GPU can draw images). In this video, Colt McAnlis walks through each of these topics and discusses where VSYNC (and the 16ms rendering barrier) comes from, and why it’s critical to understand if you want a silky smooth application.
Basic Concepts
To develop a high-performance application, you first need to understand how the hardware works. The perceived speed of an app is often misunderstood as a raw hardware processing problem, but the real root is often rendering performance. To improve rendering, you must understand VSYNC.
Series Catalog:
- Overview of Android Performance Patterns
- Android Performance Patterns: Render Performance
- Android Performance Patterns: Understanding Overdraw
- Android Performance Patterns: Understanding VSYNC
- Android Performance Patterns: Profile GPU Rendering
One of the most problematic performance problems on Android is the easiest to create; thankfully, it’s also easy to fix.
OVERDRAW is a term used to describe how many times a pixel has been re-drawn in a single frame of rendering. It’s a troublesome issue, because in most cases, pixels that are overdrawn do not end up contributing to the final rendered image. As such, it amounts to wasted work for your GPU and CPU.
Fixing overdraw has everything to do with using the available on-device tools, like Show GPU Overdraw, and then adjusting your view hierarchy in order to reduce areas where it may be occurring.
What is Overdraw?
At the beginning of the video, the author uses a house painter as an analogy: painting a wall is hard work, and if you have to repaint it because you don’t like the color, the first layer was a waste of effort. Similarly, in your application, any work that doesn’t end up on the final screen is wasted. When you try to balance high performance with perfect design, you often run into a common performance issue: Overdraw!
Overdraw represents a situation where a single pixel on the screen is painted more than once within a single frame. As shown in the image below, imagine a stack of overlapping cards. The active card is on top, while the inactive ones are buried beneath. This means the effort spent rendering those buried cards is wasted because they are invisible to the user. We are wasting GPU time rendering things that don’t contribute to the final image.
Series Catalog:
- Overview of Android Performance Patterns
- Android Performance Patterns: Render Performance
- Android Performance Patterns: Understanding Overdraw
- Android Performance Patterns: Understanding VSYNC
- Android Performance Patterns: Profile GPU Rendering
Rendering performance is all about how fast you can draw your activity, and get it updated on the screen. Success here means your users feeling like your application is smooth and responsive, which means that you’ve got to get all your logic completed, and all your rendering done in 16ms or less, each and every frame. But that might be a bit more difficult than you think.
In this video, Colt McAnlis takes a look at what “rendering performance” means to developers, alongside some of the most common pitfalls that are ran into; and let’s not forget the important stuff: the tools that help you track down, and fix these issues before they become large problems.
Android Rendering Knowledge
When you think you’ve developed a world-changing app, your users might not agree. They might think your app is slow and laggy, failing to achieve the smoothness they expect, let alone changing the world. Recycle bin, here it comes! Wait! My app is perfectly smooth on my Nexus 5? How can you say it’s slow? If you know anything about Android fragmentation, you’d know that many low-end phones don’t have the powerful processor and GPU of a Nexus 5, nor do they have an unpolluted stock system.
If a large number of users complain that your app is laggy, don’t just blame their hardware. Sometimes the problem lies within the app itself, meaning your Android app has serious rendering performance issues. Only by understanding the root cause can you solve the problem effectively. Thus, knowing how Android rendering works is essential for any Android developer.
Series Catalog:
- Overview of Android Performance Patterns
- Android Performance Patterns: Render Performance
- Android Performance Patterns: Understanding Overdraw
- Android Performance Patterns: Understanding VSYNC
- Android Performance Patterns: Profile GPU Rendering
On January 6, 2015, Google officially released a series of short videos about Android performance optimization titled Android Performance Patterns. This series is available on YouTube.
When rereading this series, separate the rendering concepts from the tooling entry points. Frame budgets, overdraw, VSYNC, and MainThread/RenderThread cooperation are still foundational. The matching tools from that era, such as Hierarchy Viewer, TraceView, Android Device Monitor, and Google+ communities, are no longer the main workflow. Use Layout Inspector/Compose Layout Inspector for View or Compose hierarchy inspection, Profile GPU Rendering and Debug GPU Overdraw for quick visual signals, Perfetto Frame Timeline/System Trace for frame lifecycle, SurfaceFlinger, CPU scheduling, and Binder relationships, and Macrobenchmark FrameTimingMetric to turn scrolling or transition paths into regression tests.
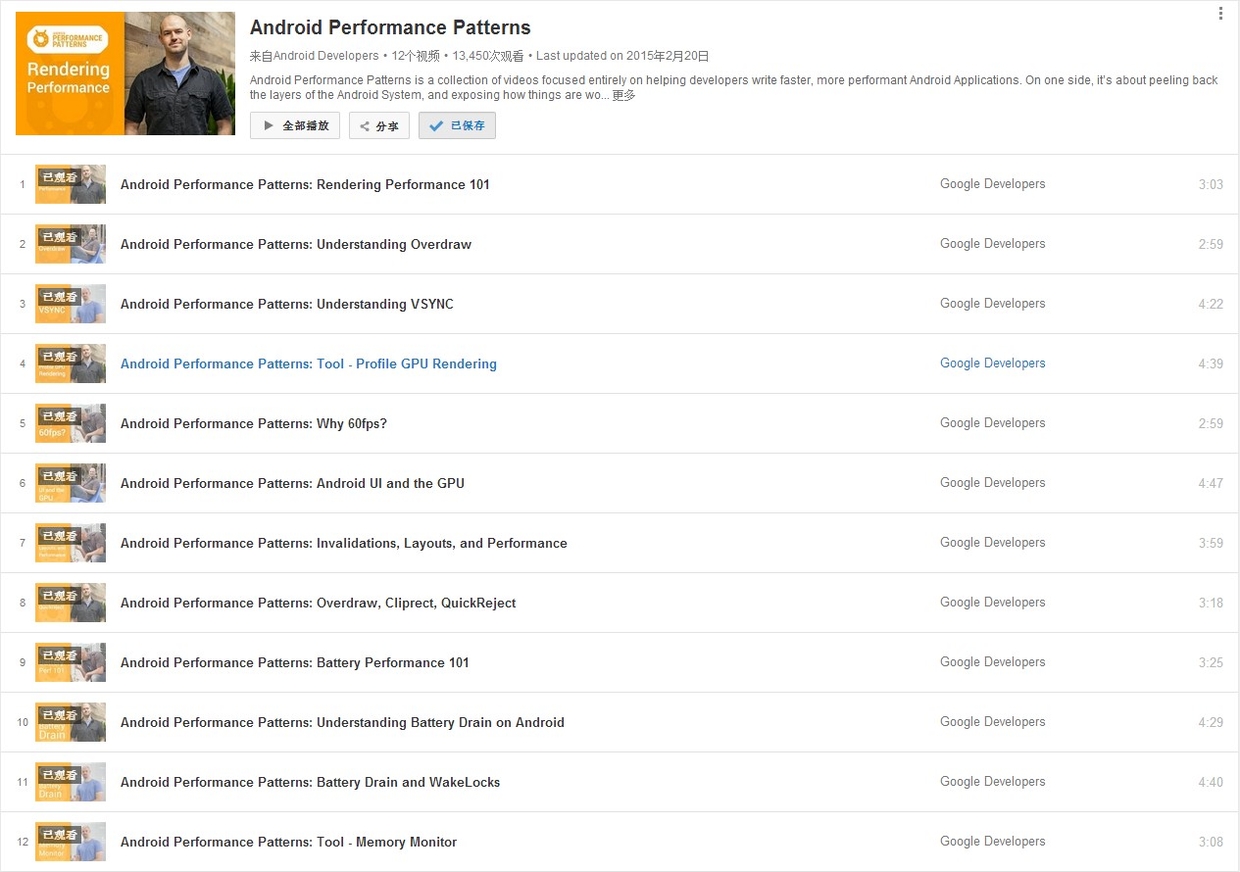
Official Introduction:
Android Performance Patterns is a collection of videos focused entirely on helping developers write faster, more performant Android Applications. On one side, it’s about peeling back the layers of the Android System, and exposing how things are working under the hood. On the other side, it’s about teaching you how the tools work, and what to look for in order to extract the right perf out of your app.
But at the end of the day, Android Performance Patterns is all about giving you the right resources at the right time to help make the fastest, smoothest, most awesome experience for your users. And that’s the whole point, right?
In short, it’s a series of videos explaining Android performance. These videos are very short, typically between 3 to 5 minutes. The speakers talk very fast, which was quite a challenge for non-native listeners before subtitles were available. The good news is that these videos now have full subtitles.
While the videos are short, they are packed with information. A single sentence mentioned by the speaker might require hours of research to understand the underlying principle or how to use a specific debugging tool. This means the series doesn’t directly teach you “how to optimize your app” step-by-step; rather, it tells you what you need to know about Android performance so that you know which tools to use, what steps to take, and what goals to aim for.
This is the final article in our MAT series, detailing how to reconstruct original images from memory snapshots to debug leaks.
- Android Memory Optimization (1) - Introduction to MAT
- Android Memory Optimization (2) - Advanced MAT Usage
- Android Memory Optimization (3) - Viewing Original Bitmaps in MAT
This article documents an older MAT technique for manually restoring Bitmap pixels from an offline heap, which is still useful when you need to identify the exact image being retained. The current investigation flow usually starts in Android Studio Memory Profiler: capture a heap dump, inspect retained size and references for Bitmap, BitmapDrawable, or image-cache objects, then export to MAT only when the offline evidence needs this manual reconstruction. If the issue involves native Bitmaps, textures, image-library caches, or system memory pressure, combine this with dumpsys meminfo, Perfetto/native heap profiling, and cache statistics from the image library itself.
When using MAT to analyze Android memory, you’ll frequently encounter Bitmap and BitmapDrawable$BitmapState objects. In many cases, these Bitmaps consume the majority of the heap. Memory leaks caused by Bitmaps are especially critical and must be handled promptly. When a potential image-related leak is found, seeing the actual image contents can be invaluable for diagnosis.
This article explains how to restore a Bitmap array object in MAT back into a viewable image.
This is the second article in our MAT series, focusing on advanced techniques for analyzing memory issues in Java and Android applications.
- Android Memory Optimization (1) - Introduction to MAT
- Android Memory Optimization (2) - Advanced MAT Usage
- Android Memory Optimization (3) - Viewing Original Bitmaps in MAT
Histogram, Dominator Tree, and thread views in this article are still central heap-analysis concepts, but the capture and first-pass analysis entry point should be modernized. Start with Android Studio Memory Profiler heap dumps, call Debug.dumpHprofData() when you need a dump at a precise point, and use retained size, references, and Activity/Fragment leak filters for the first pass. Export .hprof files to MAT only when offline large-file analysis is useful. For production or automated detection, use LeakCanary for leaks, and use dumpsys meminfo, Perfetto, or native allocation recording to fill in memory evidence outside the Java heap.
Characteristics of Java Memory Leaks
- Main features: Reachable but Useless.
- Useless: Objects created but not released after they are no longer needed.
- Inefficient: Re-creating new objects for tasks where existing ones could be reused.
Advanced MAT Techniques
Dumping Memory with Android Studio
Modern versions of Android Studio make capturing heap dumps easy: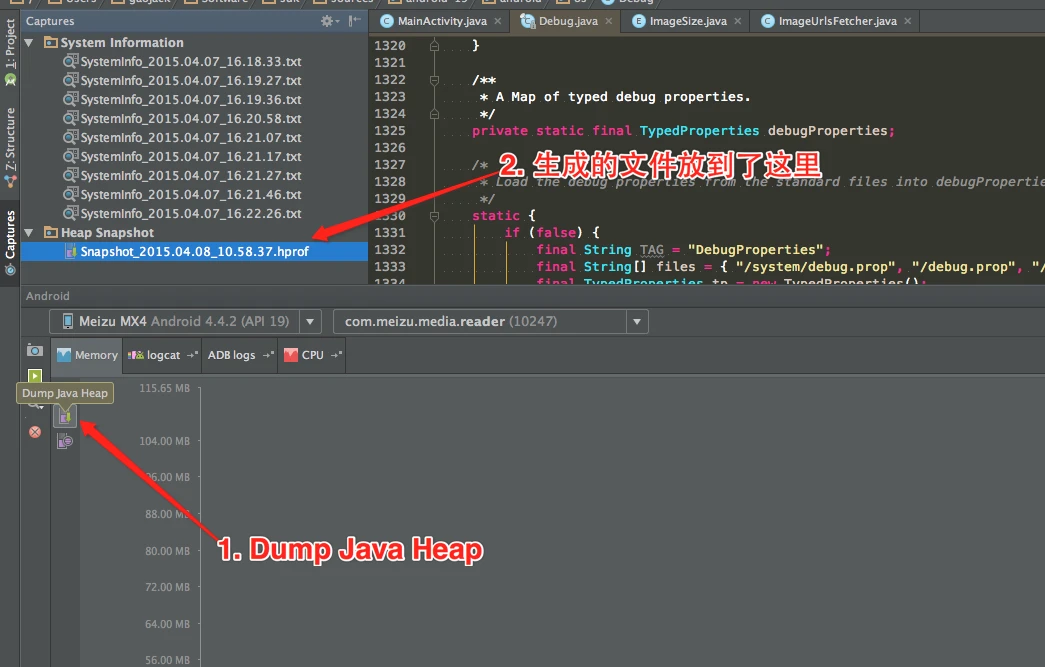
This is the first article in the series on using the MAT tool. This series consists of three articles, detailing how to use MAT to analyze memory issues, whether they are Java application memory issues or Android application memory issues:
- Android Memory Optimization (1) - Getting Started with MAT
- Android Memory Optimization (2) - Advanced MAT Usage
- Android Memory Optimization (3) - Opening Original Bitmap Images in MAT
The MAT techniques in this series are still useful for learning Java heap analysis, Dominator Tree, Retained Size, and reference chains, but the default capture flow has changed. The older path was Eclipse/DDMS exporting an Android HPROF and hprof-conv converting it for MAT. The current first stop should be Android Studio Memory Profiler: capture a heap dump, inspect class/package grouping, retained size, and references there, then export to MAT only when you need offline analysis of a large HPROF or a more specialized Dominator Tree workflow. Use LeakCanary for leak detection, and combine dumpsys meminfo, Android Studio native allocation recording, or Perfetto native heap profiling for system and native memory issues instead of relying on MAT alone.
Introduction to MAT
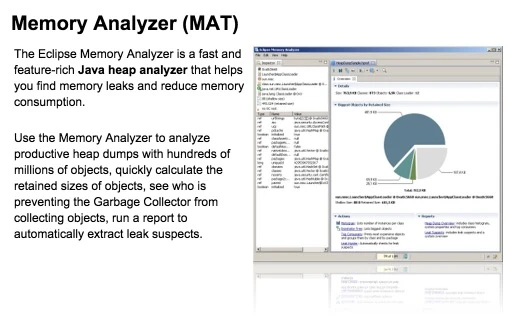
What is MAT?
MAT (Memory Analyzer Tool), a memory analysis tool based on Eclipse, is a fast and feature-rich JAVA heap analysis tool. It helps us find memory leaks and reduce memory consumption. Using the memory analysis tool to analyze numerous objects, quickly calculate the size occupied by objects in memory, see who is preventing the garbage collector from reclaiming, and visually view the objects that may cause this result through reports.
Of course, MAT also has an independent version that doesn’t rely on Eclipse, but this version requires converting the file generated by DDMS before it can be opened in the standalone version of MAT when debugging Android memory. However, the Android SDK already provides this Tool, so it is also very convenient to use.
Introduction
This article is a translation of Android Performance Case Study Follow-up by the renowned Romain Guy. It explores several techniques, methodologies, and tools for Android performance optimization.
Translation
Two years ago, I published Android Performance Case Study to help Android developers understand the tools and techniques needed to identify, track, and optimize performance bottlenecks.
That article used the Twitter client Falcon Pro as a case study. Its developer, Joaquim Vergès, was kind enough to let me use his app as an example and quickly addressed the issues I found. Fast forward to recently: Joaquim was building Falcon Pro 3 from scratch. Before its release, he contacted me about a scrolling performance issue. Once again, I had to analyze it without access to the source code.
Here’s the final round-up of Android tips I’ve been posting.
I’ve officially run out of things to post. If I ever come across something new I’ll post it but it won’t be daily anymore. It’s been fun everyone!
Here’s the fourth round-up of Android tips I’ve been posting.
Here’s the third round-up of Android tips I’ve been posting.
Following my previous article, Using Android Studio to View Android Lollipop Source Code, we know that simply reading code has its limits—understanding can remain superficial and easily forgotten. In contrast, code you’ve personally written or modified tends to leave a much deeper impression, and the process becomes easier to grasp during the implementation phase. While studying the source code, being able to modify it, run it on a phone, and see the results firsthand significantly boosts both learning efficiency and enthusiasm. This article explains how to compile the Android Lollipop source code yourself and run it on a Nexus 5.
Why compile your own firmware instead of using Google’s factory images?
Google’s factory images are “User” builds, which are highly restrictive and prevent you from pushing files to the system at will. Compiling your own “Userdebug” build gives you the freedom and root access needed for deep development.
This is a 2015 introduction to the Systrace tool. The workflows that mention Eclipse, Device Monitor, sdk/tools/systrace, and User builds being unable to capture traces are no longer the default path today. What remains useful is the basic idea: Systrace showed SurfaceFlinger, WindowManager, View, CPU scheduling, and other system behavior on one timeline. For current trace capture and analysis, start from the Android Perfetto Series Catalog.
The workflow has changed like this:
| Old flow | Current flow |
|---|---|
| Click Systrace in Eclipse / Android Studio Device Monitor | Use System Tracing from Developer Options, or run adb shell perfetto |
python systrace.py --time=10 -o trace.html ... |
adb shell perfetto -t 10s -b 64mb ... --out /data/misc/perfetto-traces/trace.perfetto-trace |
| Generate HTML and open it in Chrome | Generate .perfetto-trace and open it in Perfetto UI or trace_processor |
| Mainly zoom and click inside the HTML view | Read tracks and slices first, then narrow evidence with search, SQL, and metrics |
| User builds were treated as mostly unusable | User builds can capture limited information; system-level detail still benefits from Userdebug/eng |
This is the first article in the Android Performance Optimization Tools series. This series mainly introduces the tools used during the Android performance optimization process, how to use these tools to discover problems, and how to solve them. In terms of performance optimization, Android provides many performance tools for everyone to use. Following our consistent “discover problem - solve problem” thinking, discovering the problem is the most important part. Trying to solve a problem without first identifying it properly often leads to half the effort for twice the result.
In this article, we’ll start with a brief introduction to the Systrace tool.
Introduction to Systrace
Systrace is a performance data sampling and analysis tool introduced in Android 4.1. It helps developers collect execution information from key Android subsystems (such as SurfaceFlinger, WindowManagerService, and other critical Framework modules, services, and the View system), allowing for a more intuitive analysis of system bottlenecks and performance improvements.
Systrace’s capabilities include tracking system I/O operations, kernel workqueues, CPU load, and the health of various Android subsystems. On the Android platform, it’s composed of three main parts:
- Kernel Space: Systrace leverages the
ftracefeature in the Linux Kernel. Therefore, to use Systrace, the relevantftracemodules in the kernel must be enabled. - Data Collection: Android defines a
Traceclass that applications can use to output statistical information toftrace. Additionally, theatraceprogram in Android reads statistical info fromftraceand passes it to data analysis tools. - Data Analysis Tools: Android provides
systrace.py(a Python script located inAndroid SDK directory/platform-tools/systracethat callsatraceinternally) to configure data collection (such as tags, output filename, etc.), collectftracestatistics, and generate a resulting HTML file for user viewing. Essentially, Systrace is a wrapper around the Linux Kernel’sftrace. Applications need to utilize theTraceclass provided by Android to use Systrace.
Official documentation and usage for Systrace can be found here: Systrace